BRINKER INTERNATIONAL (EAT)·Q2 2026 Earnings Summary
Brinker Beats on Q2 FY2026, Raises Full-Year Guidance Despite Winter Storm Impact
January 28, 2026 · by Fintool AI Agent
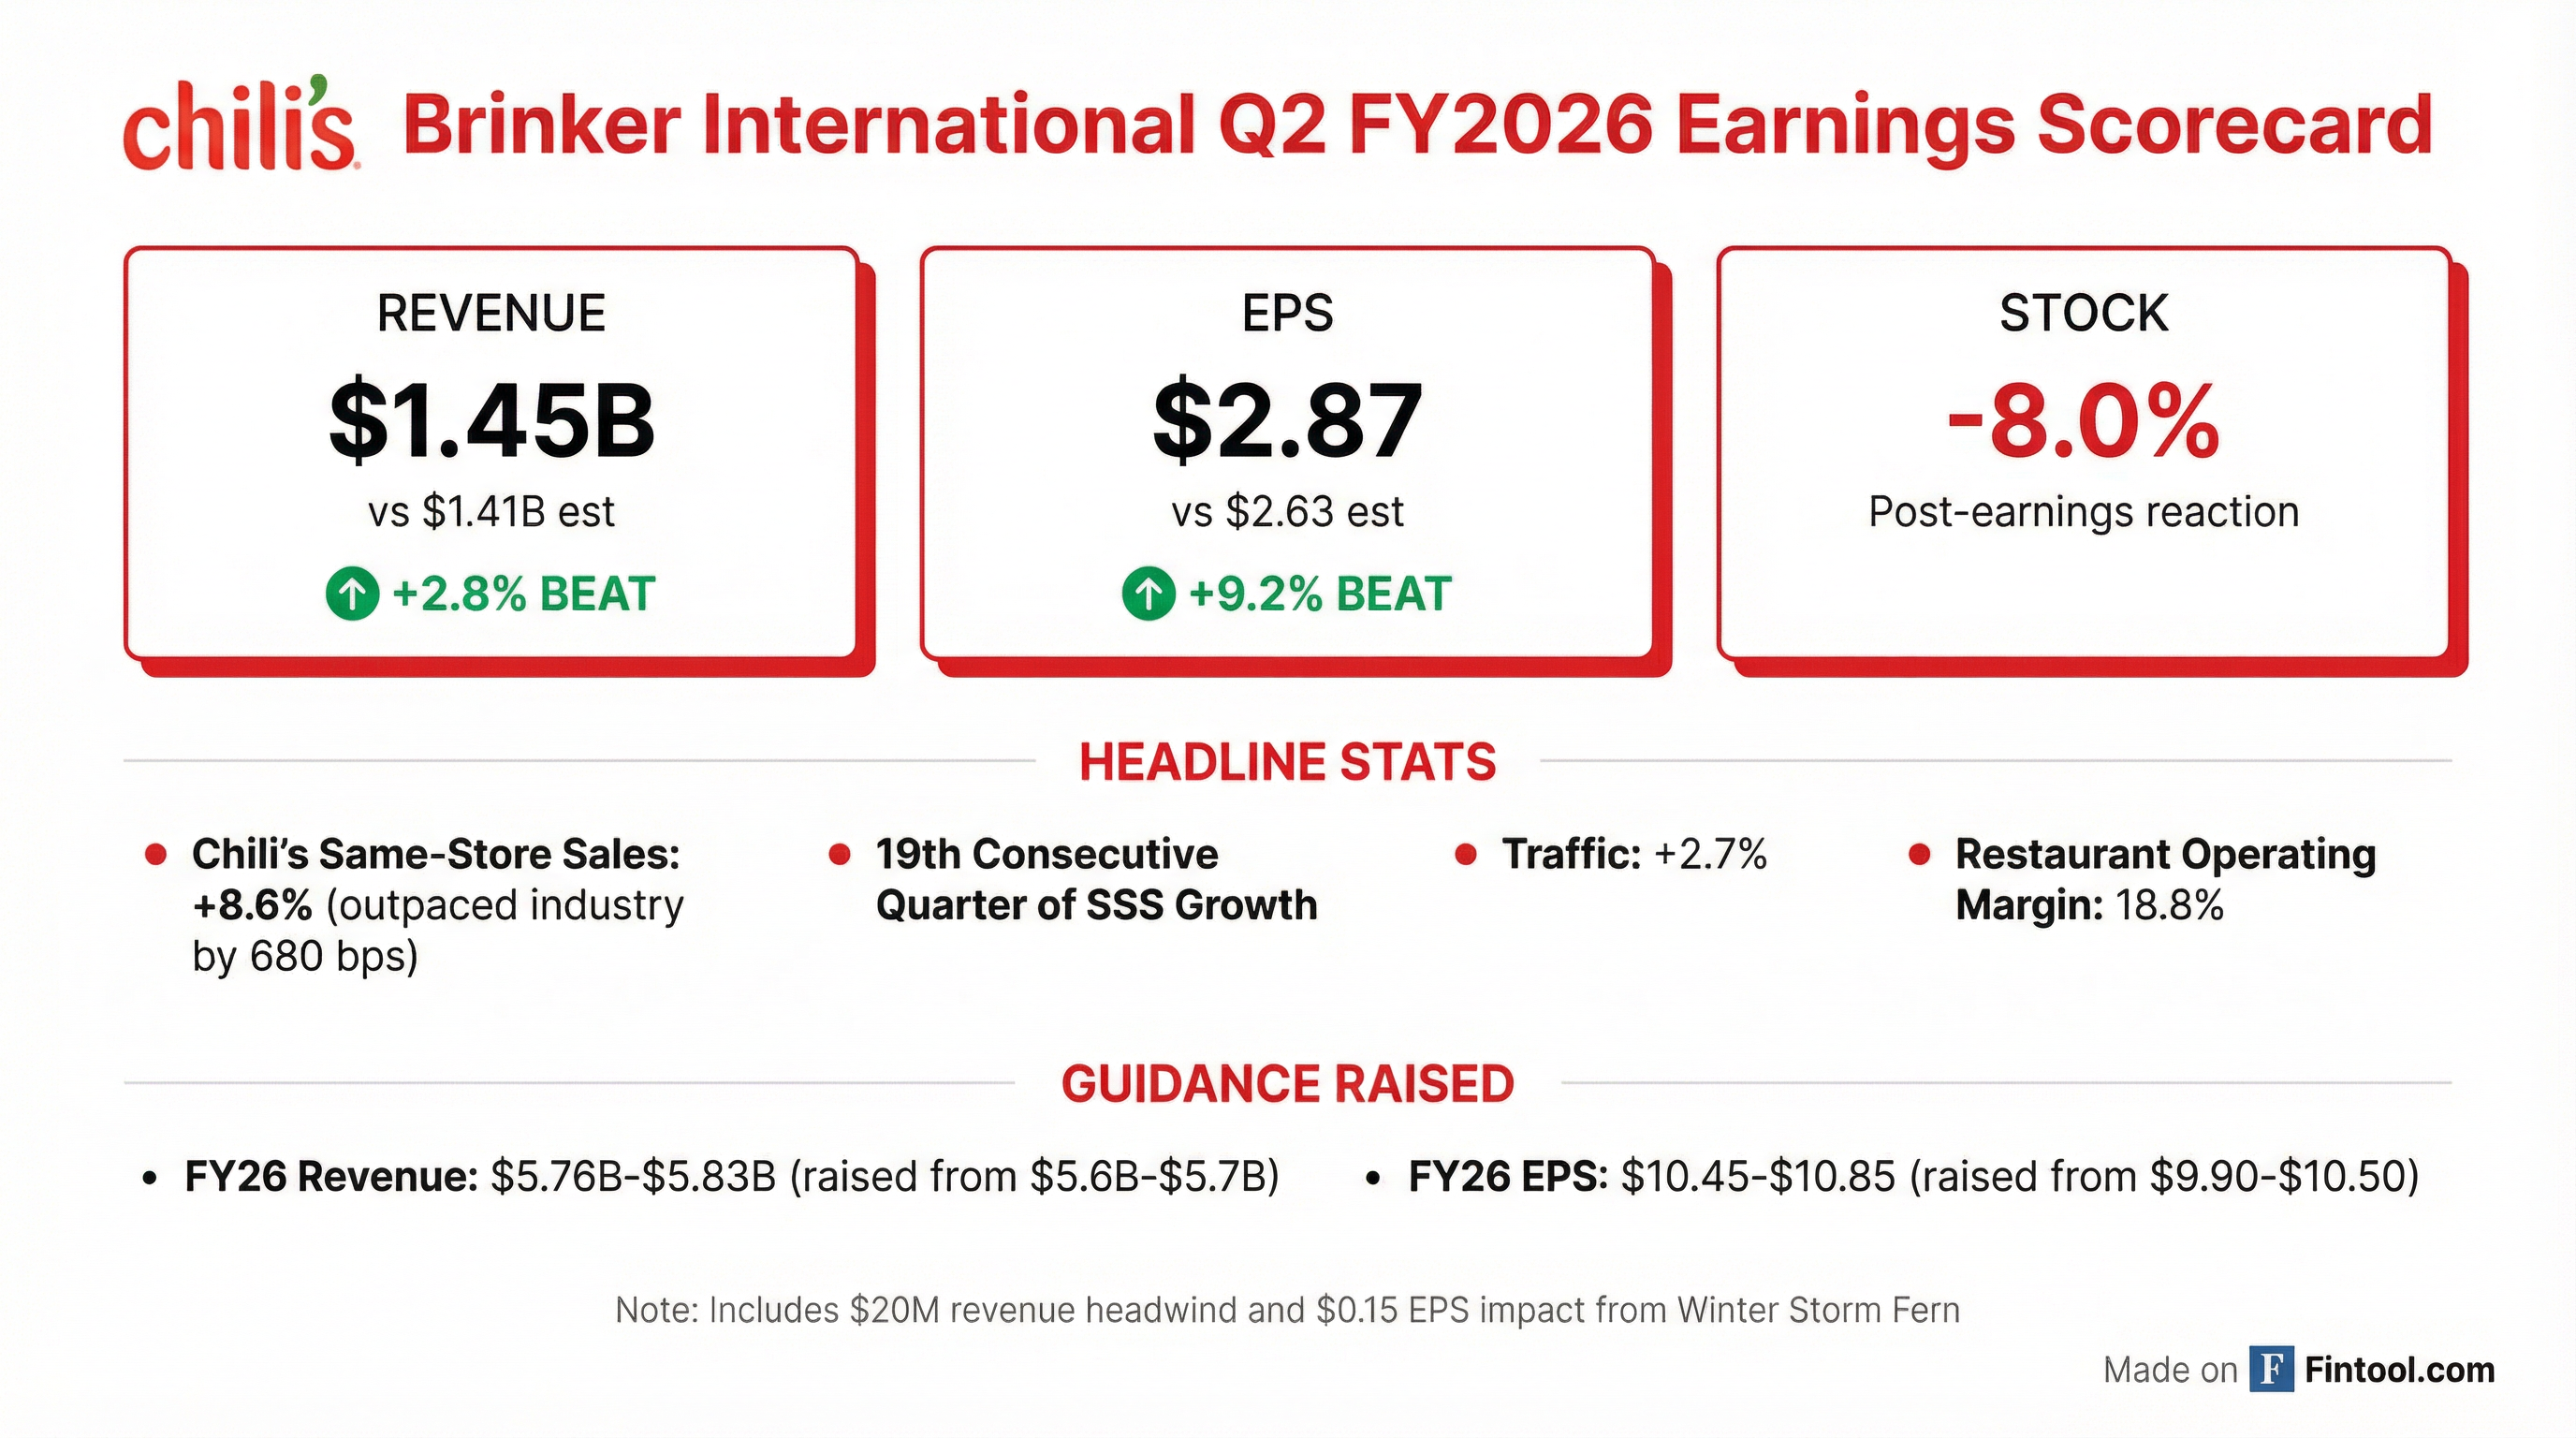
Brinker International delivered another beat-and-raise quarter, with Q2 FY2026 revenue of $1.45 billion (+2.8% vs consensus) and adjusted EPS of $2.87 (+9.2% vs consensus), driven by Chili's 19th consecutive quarter of same-store sales growth. Management raised full-year guidance despite absorbing an estimated $20 million revenue and $0.15 EPS impact from Winter Storm Fern. The stock dropped ~8% despite the beat, suggesting the market may have expected an even larger guidance raise given the strong underlying trends.
Did Brinker Beat Earnings?
Yes — both revenue and EPS exceeded consensus expectations.
Chili's comp sales of +8.6% drove the beat, outpacing the casual dining industry by 680 basis points while lapping a +31.4% comp from the prior year. This marks a 2-year cumulative comp of 43% and a 4-year comp of 62%.
Beat streak continues: Brinker has now beaten EPS estimates for 8 consecutive quarters, with particularly large beats during the turnaround acceleration phase:
What Did Management Guide?
Guidance raised across all metrics despite Winter Storm Fern impact.
The guidance raise is notable because it absorbs approximately $20 million in lost revenues and $0.15 in EPS from Winter Storm Fern closures through January 27.
Back-half expectations:
- Chili's same-store sales expected in "solid mid-single-digit range"
- Q3 traffic could be "flat to slightly negative" due to storm and holiday calendar shift
- Q4 traffic expected positive
- Commodity inflation now expected in low single digits for full year (mid-single digits in back half)
How Did the Stock React?
Stock fell ~8% despite the beat-and-raise.
The market reaction was notably negative:
- Pre-market open: $167.12
- Intraday high: $168.48
- Close: $153.77 (-7.99% from prior close)
- Intraday low: $152.89
The selloff likely reflects:
- Storm uncertainty: Management acknowledged "upside or downside on the storm could still be playing out"
- Margin pressure: Restaurant operating margin of 18.8% was down 30 bps YoY
- Valuation: Stock had run ~55% over the prior 12 months
- Holiday calendar shift: Christmas Day traded out of Q2 into Q3, providing a 1.2% favorable comp impact that will reverse
What Changed From Last Quarter?
Key deltas vs Q1 FY2026:
Notable changes:
- Guidance raised: After being reiterated last quarter, management finally raised FY26 guidance
- Reimage progress: Completed first 4 reimages; lowest-cost version is emerging as the winner
- Menu innovation: Skillet Queso reintroduction successful (+20% queso sales), nachos relaunch (+170% vs prior), triple-bacon burger doing 30-43% more sales than prior version
- Chicken sandwich: Now in 200 restaurants for testing, national launch with advertising in April
What stayed the same:
- Industry-leading value positioning maintained ($3 below direct competitors, $4 below casual dining average)
- Operational metrics improving across the board — GWAP at 2.1% vs 2.9% prior year, food grade scores improved from 68% to 74%, intent to return from 72% to 78%
- Third-party syndicated data now ranks Chili's in top 3 of all 7 key metrics (quality, value, service, atmosphere, taste, cleanliness, overall experience) — was at or near bottom of competitive set when turnaround started
- Maggiano's remains a drag (SSS -2.4%, 8% of sales, 3% of profit)
What's Driving Margin Changes?
The earnings slide deck provides a detailed walk of cost structure changes from Q2 FY2025 to Q2 FY2026:
Food Cost: 25.5% → 25.7% (+20 bps YoY)
The increase was driven by unfavorable menu mix (likely from value menu success) offsetting pricing benefits.
Labor Cost: 31.3% → 31.0% (-30 bps YoY)
Strong sales leverage more than offset wage and benefit inflation.
Restaurant Expense: 24.1% → 24.5% (+40 bps YoY)
Higher advertising spend (+60 bps) and delivery costs (+40 bps) drove the increase despite sales leverage benefits.
Same-Store Sales: Full Segment Breakdown
Source: Brinker Q2 FY2026 earnings slide deck
Key insight: Chili's continues to outpace both the broader Brinker portfolio and franchise segments, demonstrating company-operated execution advantage.
Key Management Quotes
On the turnaround sustainability:
"The Chili's turnaround is real, it is sustaining, and we have no intentions of taking our foot off the gas... Q2 results were driven by our world-class marketing and brand building that brought guests in and continued improvements in food, service, and atmosphere that brought guests back." — Kevin Hochman, CEO
On value leadership:
"Chili's has been repositioned to win for the long term... Black Box data is telling us our per person check average is still more than $3 less than our direct casual dining competitors, and more than $4 less than casual dining as a whole." — Kevin Hochman, CEO
On the reimage program:
"The first thing I would tell you is the guests and the team members absolutely love all four of the reimage units... The one that has actually the lowest cost is the one that everybody's gravitating towards as the best." — Kevin Hochman, CEO
Forward Catalysts
Near-term (Q3-Q4 FY2026):
- Chicken sandwich launch (April): National rollout with "substantial advertising campaign" targeting the largest restaurant chicken segment
- 8-10 more reimages expected by end of FY2026
- $100M share repurchase executed in Q2; program continues
Medium-term (FY2027-2028):
- 60-80 reimages in FY2027, ramping to 10% of system (~100+ units) in FY2028
- New unit growth expected to accelerate in FY2028 (low single-digit % growth)
- Investor Day planned for later this year with reimage tours and long-term TAM discussion
Risks to monitor:
- Maggiano's remains a headwind (mid-single-digit negative SSS expected in back half)
- Beef inflation in back half (mid-single digits)
- Manager incentive structure changes still 1-2 years out
Q&A Highlights
On demand trends (Jeff Farmer, Gordon Haskett): CFO Mika Ware noted December was "tougher for the industry, but then January looked really good, and then the weather hit." CEO Hochman emphasized focus on controllables: "Whether the economy gets better and the consumer gets better or worse, having a better experience is gonna win trips."
On the barbell pricing strategy (Chris O'Cull, Stifel): Asked about whether the $10.99 price point could become a "structural ceiling," Hochman explained: "We have good, better, best price tiers... not every guest wants the cheapest thing on the menu." The company manages mix to keep $10.99 sales constant while driving innovation at higher tiers.
On consumer cohorts (Christine Cho, Goldman Sachs): The under-$60K income cohort is "no longer the fastest growing" — there was "a little bit of shift... to the higher income cohorts," though nothing material enough to highlight proactively.
Data sourced from Brinker International Q2 FY2026 earnings call transcript and company filings. Consensus estimates from S&P Global.